You can view your traffic reports by following the steps presented in this page.
Note: the higher the traffic is on the website, the higher the CPU consumption is.
The first thing you need to do is to log in to Streaming platform Support ticket system.
Once logged in, click on the Servers button on the right header bar:
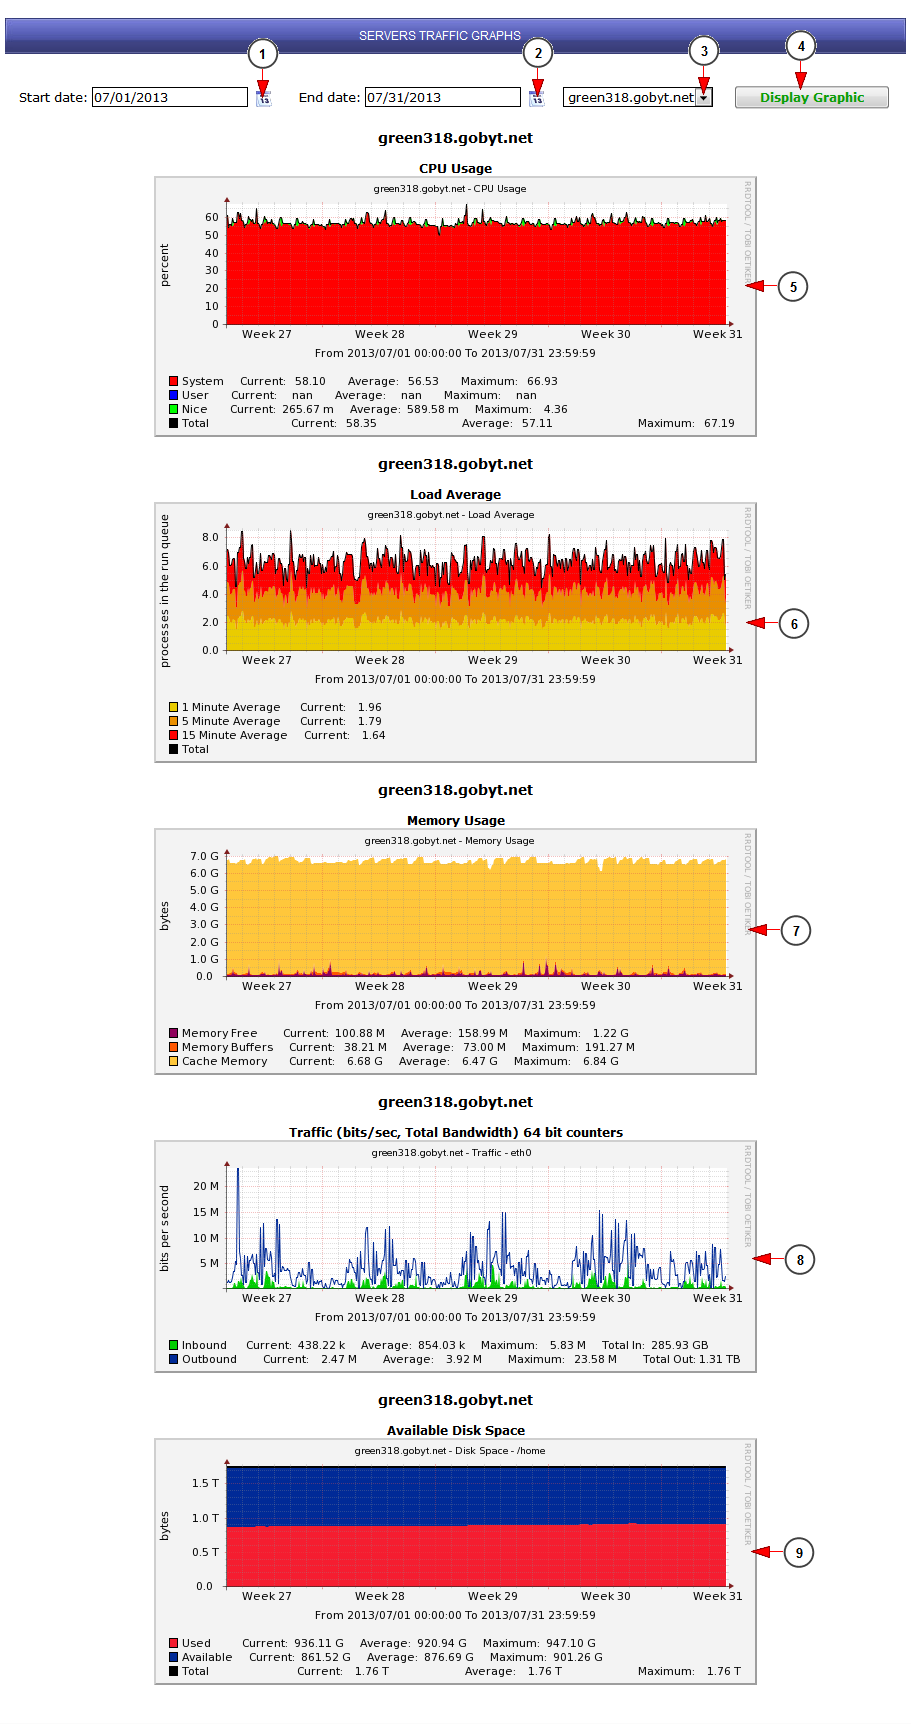
The Servers Reports page will open as you can see in the following picture:
1. Click here to select the start date to filter your search
2. Click here to select the end date to filter your search
3. Select from the drop-down menu the Server for which you want to view the reports
4. Click to Display Graphic
5. Here you can view the CPU usage reports
6. Here you can view the load average reports
Note: a value more than 20 units is considered a critical load
7. Here you can view the memory usage reports
8. Shared clients receive the traffic reports
Note: clients who have dedicated servers will see all the graphs displayed
9. Here you can view the available disk space reports
Example of traffic report for dedicated servers
In order to view the traffic report for the server, scroll down to Graphic named: Traffic (bits/sec, Total Bandwidth) 64 bit counters:
1. Make sure you check the graphic for ethO
2. Here you can see the total bandwidth in
3. Here you can see the total bandwidth out
Note: total bandwidth traffic made on the server is Total in + Total out
Example of traffic report for shared servers
1. Here you can see the total bandwidth in
2. Here you can see the total bandwidth out
Note: the total traffic report is calculated as the sum of 1 and 2 in picture above


