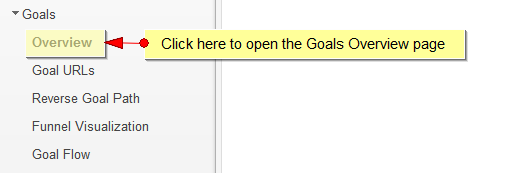
Once logged into Analytics dashboard, click Admin, and navigate to the desired view. In the VIEW column, click Goals.
To view the Goals Overview report, click on Overview link under Goals section
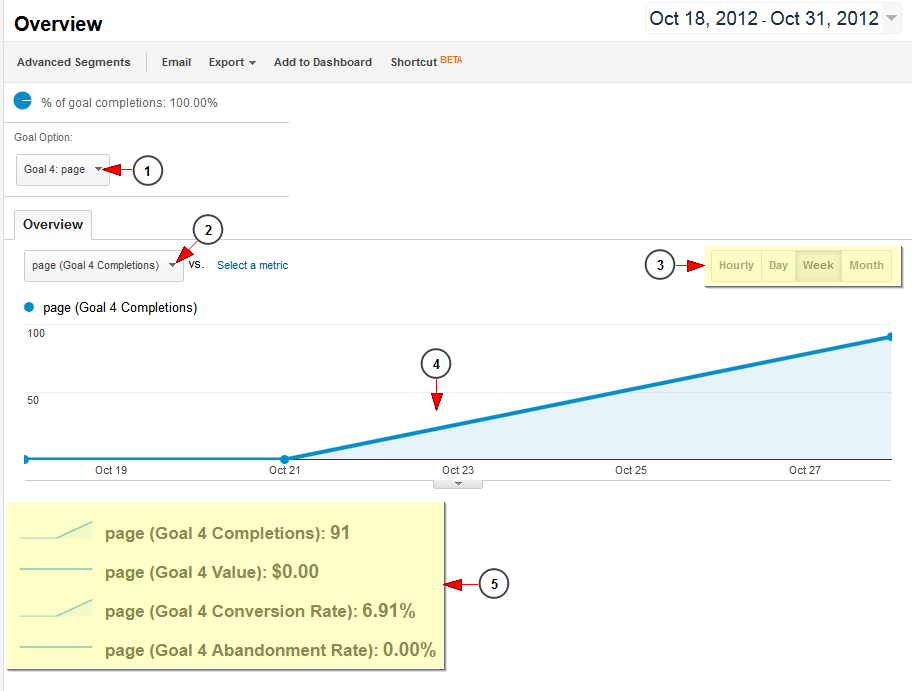
Once the page opens you can select the goal for which you want to see the report
1. Click here to select a Goal set
2. Click here to select a goal from the set
3. Click on the time tab which you desire to see the goal graphic for: hourly, day, week, month
4. Here you can see the goal graphic
5. Here you can see the details of the goal: completion, value, conversion rate, abandonment rate
Note: We have explained into this TikiLIVE manual page the basic items that you can use form Google Analytics. You can check the Google dedicated page related to Analytics Help for a more detailed functionality.


