Important: this section is available only for users who have purchased and installed QOS optional module.
Logged in admin dashboard, click on Session Metrics, in Reports chapter:

Once the page opens, you can see the session metrics for all broadcasters:
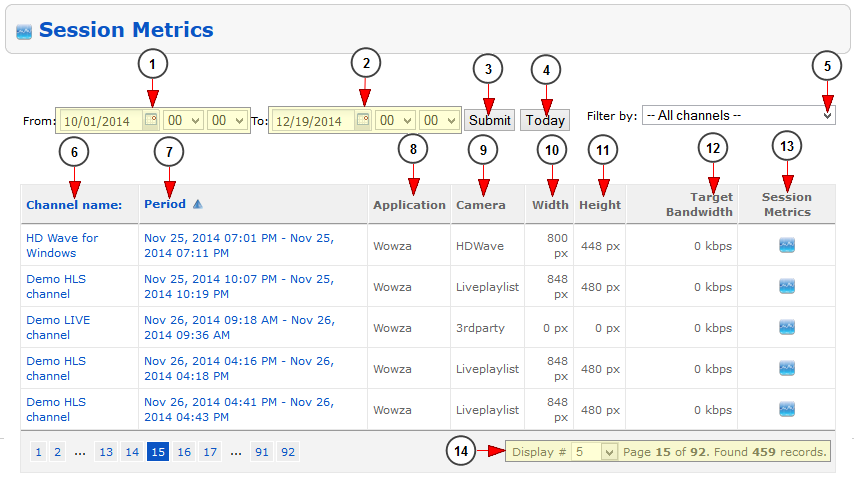
1. Click on the calendar and on the drop down menus to select the start date and time for your report.
2. Click on the calendar and on the drop down menus to select the end date and time for your report.
3. Click here to submit the selected times for the report.
4. Click here to view the session metrics for the current day.
5. Click here to filter the channel for which you want to see the metrics report.
6. Here you can see the name of the channel. Click on the name and you will be redirected to the Edit channel page.
7. Here you can see the time period for the displayed graphics. Click on the link to view the metrics charts for the channel.
8. Here you can see the name of the broadcasting application.
9. Here you can see the camera used for live streaming.
10. Here you can see the width for encoding the live stream.
11. Here you can see the height for encoding the live stream.
12. Here you can see the targeted Bandwidth for encoding the live stream.
13. Click here to view the session metrics for the channel.
14. Here you can see the pagination index, the number of records found and you can select how many items you want to see displayed on the page.