Note: QOS metrics are available for live streaming using HD Wave and also for playlists playback using Channel Manager. QOS metrics for viewers are not available from embedded websites
Click on the Channels Listing link in Channel Management chapter to view the list of channels from the system:
The Channels Listing page will open as you can see in the following picture:
Click on the Channel Metrics icon to view the Metrics page
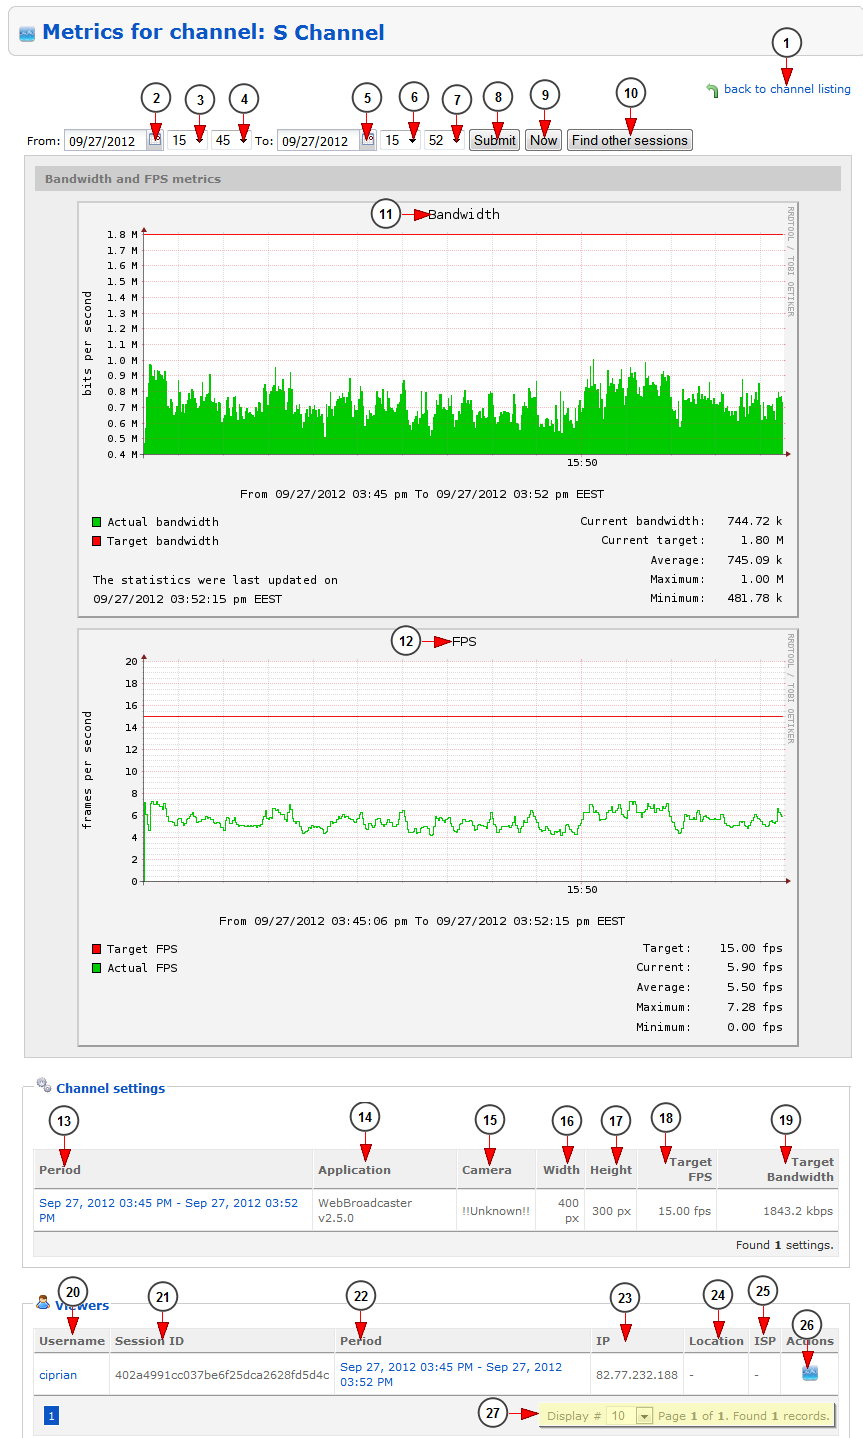
The page will open as you can see in the following picture and we will detail each section:
1. Click here to go back to users listing page
2. Click on the calendar to select a filtering start date
3. Click on the drop down list to choose the exact starting hour
4. Click on the drop down list to choose the exact starting minute
5. Click on the calendar to select a filtering end date
6. Click on the drop down list to choose the exact hour
7. Click on the drop down list to choose the exact minute
8. Click here to submit the selected time filters
9. Click here to view the metrics for the current time
10. Click here to find other sessions – live streaming sessions from other channels from that specific period of time
Note: this may be helpful when a user reports an issue related to the channel streaming and the admin can check if the other channels which were live streaming, had experienced the same issue
11. Here you can see the chart for the Bandwidth Metrics
12. Here you can see the chart for the FPS Metrics
13. Here you can see the time period for the displayed graphics. Click on the link to view the metrics for the channel
14 Here you can see the name of the broadcasting application
15. Here you can see the camera used for live streaming
16. Here you can see the width for encoding the live stream
17. Here you can see the height for encoding the live stream
18. Here you can see the targeted FPS for encoding the live stream
19. Here you can see the targeted Bandwidth for encoding the live stream
20. Here you can see the username of the viewer. Click on the link to view the user’s profile page
21. Here you can see the session ID
22. Click on the time period link to see playback metrics for the viewer and channel
23. Here you can see the IP of the viewer
24. Here you can see the location of the viewer
25. In this column you can see the ISP name of the viewer
26. Click on the icon to view the playback metrics for the viewer and channel
27. Here you can see the pagination index, the number of records found and you can select how many records you want to see displayed on the page
Bandwidth Metrics
1. Here you can see the period of time for the listed bandwidth graphic
2. The green area shows the consumed upstream bandwidth of the broadcaster
3. The red line represents the targeted bandwidth
4. Here you can see the date when the statistics were last updated
5. Here you can see the current upstream bandwidth (last recorded value) expressed in kilobytes per second
6. Here you can see the current target bandwidth (last recorded value) – 819.20 kilobytes in the example above
7. Here you can see the average bandwidth expressed in kilobytes per second
8. Here you can see the maximum bandwidth expressed in kilobytes per second
9. Here you can see the minimum bandwidth expressed in kilobytes per second
Note: the desired quality can be achieved if the actual bandwidth matches the targeted bandwidth
FPS Metrics
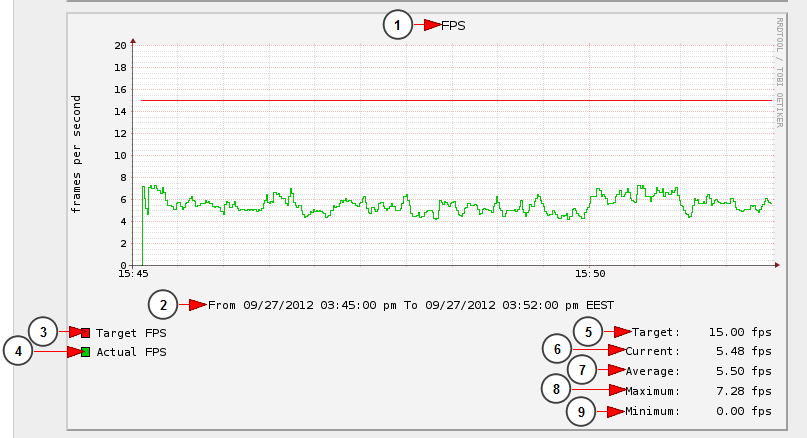
1. Here you can see the name of the listed graphic: FPS
2. Here you can see the period of time for the listed bandwidth graphic
3. The red line represents the targeted upstream FPS
4. The green area shows the actual upstream FPS from the broadcaster’s channel
5. Here you can see the current upstream FPS from the broadcaster’s channel
6. Here you can see the current upstream FPS – 5.48 frames per second in the example above
7. Here you can see the average upstream FPS
8. Here you can see the maximum upstream FPS
9. Here you can see the minimum upstream FPS
Note: the desired quality can be achieved if the actual number of FPS matches the targeted number of FPS


