Once logged into Analytics dashboard, click Admin, and navigate to the desired view. In the Property column, click Audience.
Audience Overview
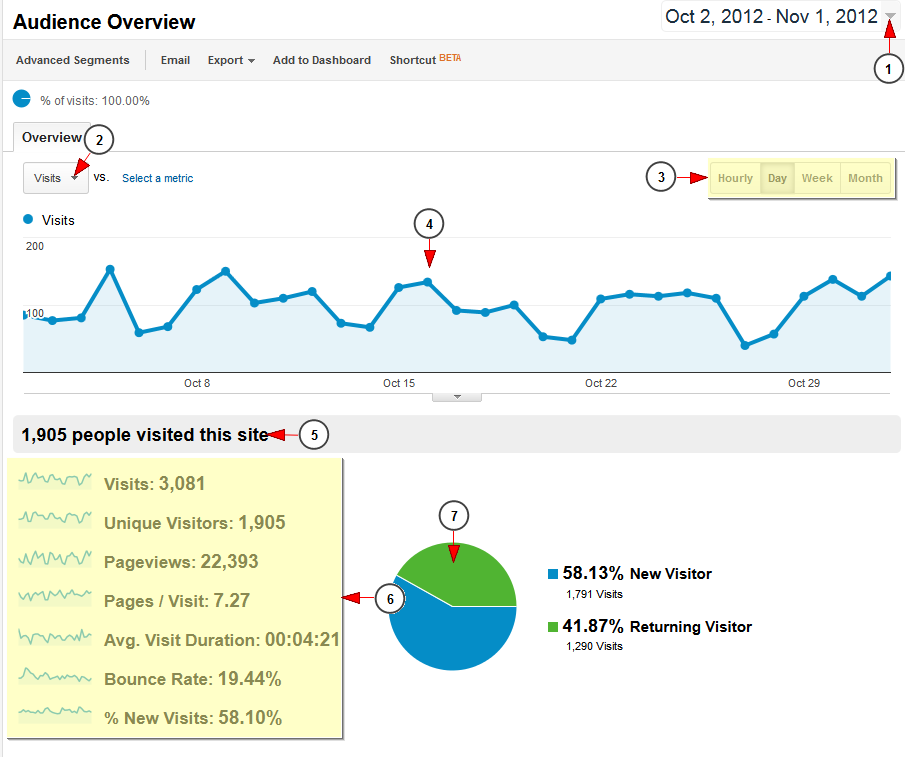
1. Click here to select the period of time for which you want to see the audience report
2. Click on the drop down to select the graphic you want to see from the following values:
- Visits (total number of visits to your site)
- Unique Visitors (total number of unique visitors to your site)
- Page views (total number of pages viewed on your site)
- Pages per Visit (average number of pages viewed per visit)
- Average Visit Duration (average visit length of all visitors)
- Bounce Rate (percent of single-page visits)
- New Visitors (percent of total visitors who visited your site for the first time)
3. Click on the time tab which you desire to see the graphic for: hourly, day, week, month
4. Here you can see the audience graphic
5. Here you can see the total number of visitor on the website
6. Here you can see the detailed information for all the values
7. Here you can see the ratio and the percentage of new vs returning visitors
Note: We have explained into this TikiLIVE manual page the basic items that you can use form Google Analytics. You can check the Google dedicated page related to Analytics Help for a more detailed functionality.

