Once logged into Analytics dashboard, click Admin, and navigate to the desired view. In the VIEW column, click Goals.
The Goal Flow Report visualizes the path your visitors traveled through a funnel towards a Goal. This report can help you see if visitors are navigating sections of your website and completing a targeted objective as you expect them to.
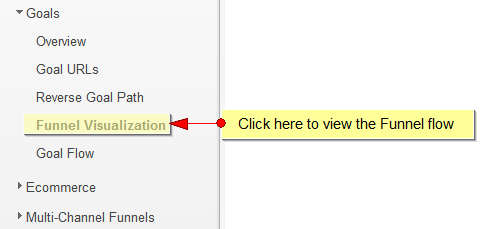
To view the funnel flow for a destination goal click on Funnel Visualization, under Goals section:
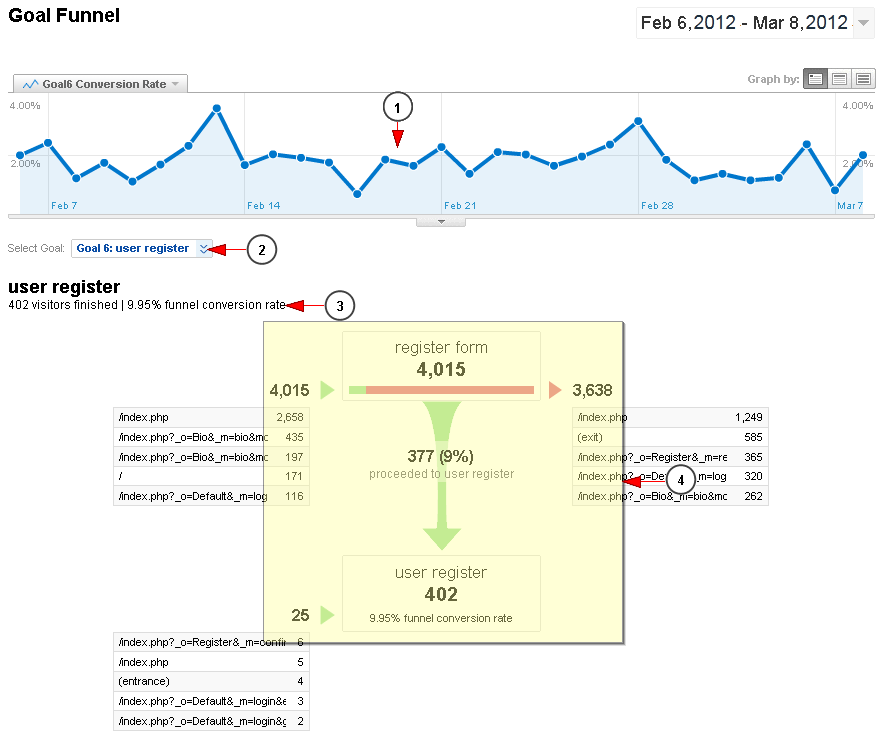
Once the page opens you will see the goal funnel graphic:
1. This is the graphic of your goal
2. Click here to select the goal
3. Here you can see the details of your goal and the funnel percentage
4. Here you can see the funnel flow
Example:
In picture above the destination goal was to see how many users complete the registration process on the website (402 users)
The funnel step was the number of users who land on the Register page (4015). From these users, only 377 finished the registration process. Another 25 users completed the registration form, from an affiliate website
Note: We have explained into this TikiLIVE manual page the basic items that you can use form Google Analytics. You can check the Google dedicated page related to Analytics Help for a more detailed functionality.


