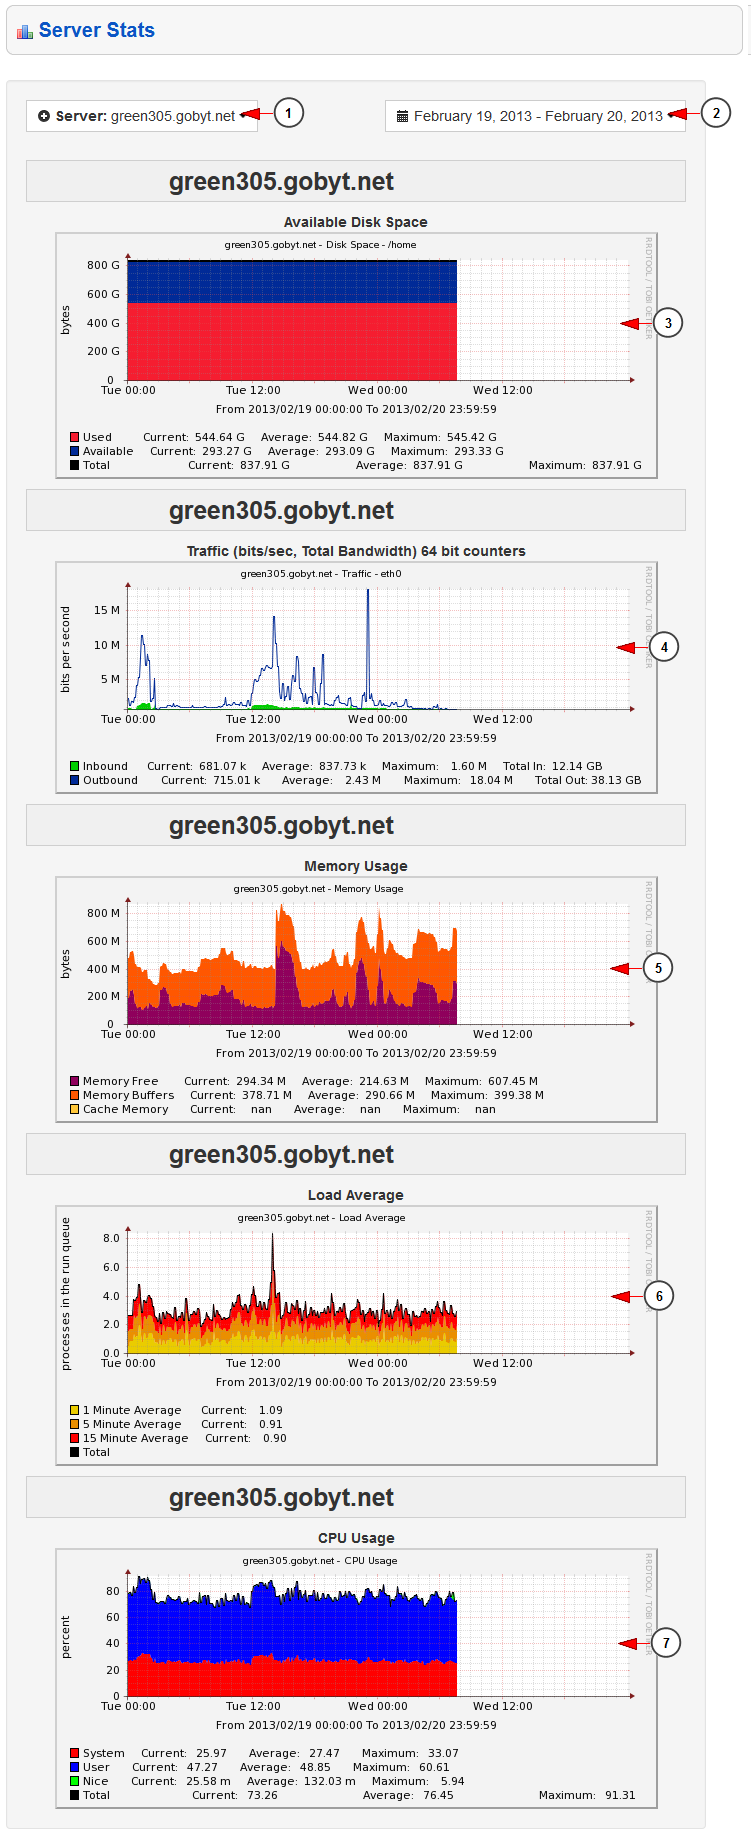
You can view your cacti reports for dedicated servers by clicking on the Server Stats link under Reports section in admin dashboard:
Once the page opens you can select the dedicated server for which you want to see the reports:
1. Click on the drop down menu to select the server
2. Click on the drop down menu to select period of time for which you want to see the reports: current day, previous day, the last 7 days, the last 30 days, current month, previous month or a custom range period
3. Here you can view the available disk space reports. If you click on the graphic you can view the detailed server reports
4. Shared clients receive the traffic reports. If you click on the graphic you can view the detailed server reports
Note: dedicated clients receive all cacti reports
5. Here you can view the memory usage reports. If you click on the graphic you can view the detailed server reports
6. Here you can view the load average reports. If you click on the graphic you can view the detailed server reports
Note: a value more than 20 units is considered a critical load
7. Here you can view the CPU usage reports. If you click on the graphic you can view the detailed server reports
Custom time period
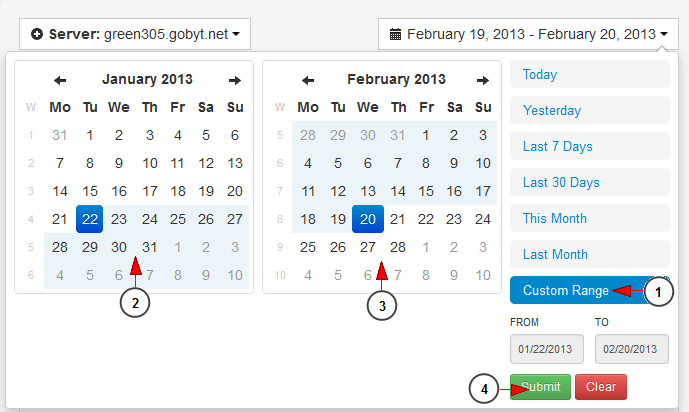
You can select a custom range time period for which you want to see the reports displayed:
1. Click here to select the desired period of time
2. Select the start date for the reports display
3. Select the end date for the reports display
4. Click here to view the reports for the selected time period
Detailed server reports
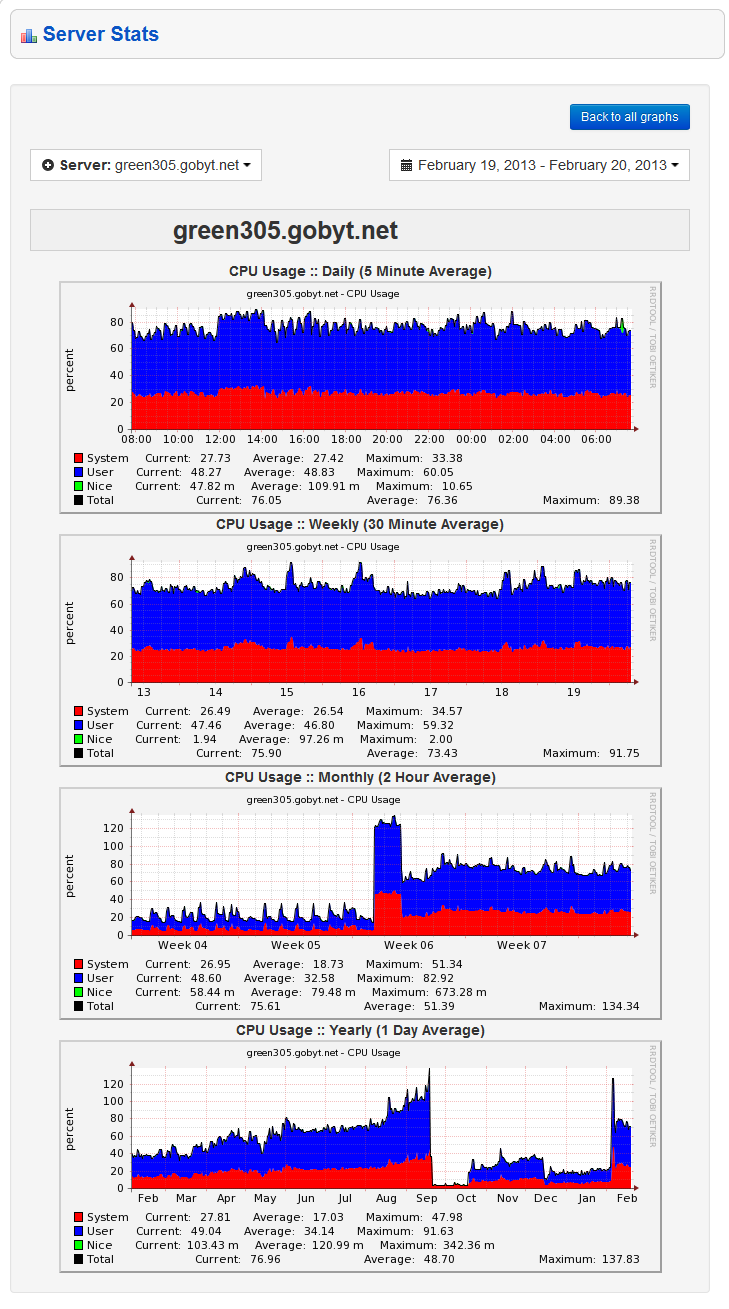
When you click on a specific graph the site owner can view the detailed server reports: daily (5 minute average), weekly (30 minute average), monthly (2 hour average), yearly (1 day average)
Below you can see an example of a detailed graphic report for the CPU usage:


