The administrator of the platform can always check the status of servers from admin dashboard.
Logged in admin dashboard, click on Service Health Status page, under Reports section:
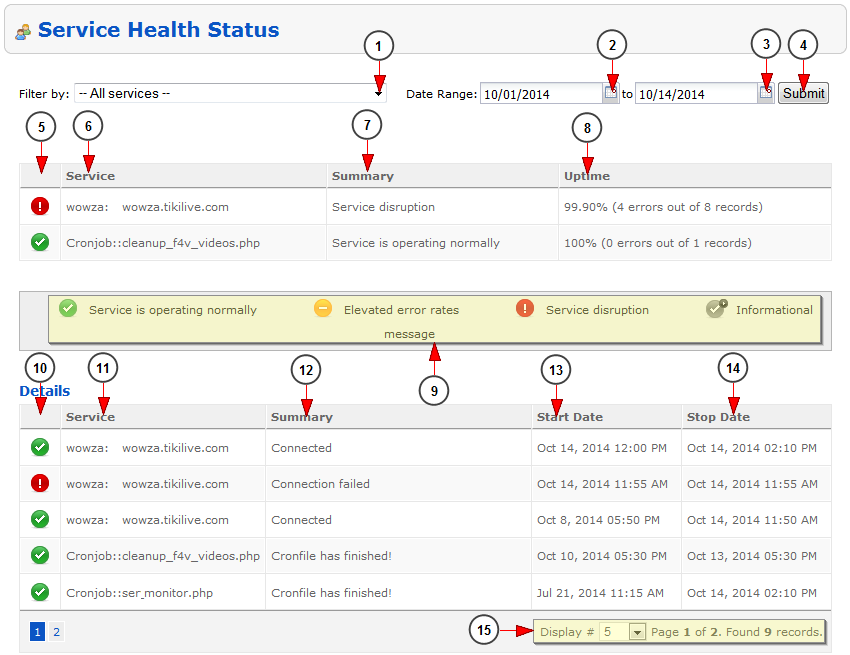
Once the page opens, the admin can use the filters to select the desired server or time period to see the report:
1. Select from the drop-down menu the desired service.
2. Click here to select a start date to filter the report.
3. Click here to select an end date to filter the report.
4. Click here to start the search for the jobs started on the selected time period.
5. Here you can see the status of the service: operating normally, error messages, service disruption, informational.
6. Here you can see the name of the service.
7. Here you can see the service summary.
8. Here you can see the uptime.
9. Here you can see the service status legend.
10. Here you can see the status of the service: operating normally, error messages, service disruption, informational.
11. Here you can see the name of the service.
12. Here you can see the service summary.
13. Here you can see the server start date.
14. Here you can see the server stop date.
Note: The stop date is showing the date when the service ran last time.
15. Here you can see the pagination index, the number of records found and you can select how many items you want to see displayed on the page.


